import numpy as np
import pandas as pd
from scipy import stats
import matplotlib.pyplot as pltInferencial Statistics
Statistical inference is a process in which conclusions about populations or processes are drawn from a sample of data using statistical methods.
Keywords
inferencial statistics, what is inferencial statistics, chi-square, chi-square test, normal distribution, standard normal, p-value, z-value, hypothesis testing, anova

Hypothesis Testing Tutorial
Objective: This tutorial introduces hypothesis testing, one of the key statistical concepts used to make decisions based on data. We will use Python and the SciPy library to conduct hypothesis testing.
1. What is Hypothesis Testing?
Hypothesis Testing is a statistical method used to make decisions or inferences about a population parameter based on sample data. It helps determine if there is enough evidence to reject a null hypothesis in favor of an alternative hypothesis.
2. Types of Hypotheses
- Null Hypothesis (H₀): This is the default assumption that there is no effect or no difference. For example, “There is no difference in mean height between men and women.”
- Alternative Hypothesis (H₁): This opposes the null hypothesis, stating that there is an effect or difference. For example, “There is a difference in mean height between men and women.”
3. Steps in Hypothesis Testing
- Define Hypotheses: Set the null and alternative hypotheses.
- Select Significance Level (α): The probability threshold (commonly 0.05) below which the null hypothesis is rejected.
- Choose the Test Statistic: Based on the type of data and sample size, e.g., t-test, chi-square test.
- Compute p-value: This is the probability of observing the data if the null hypothesis is true.
- Make a Decision:
- If p-value < α, reject the null hypothesis.
- If p-value ≥ α, fail to reject the null hypothesis.
4. Common Hypothesis Tests
- One-sample t-test: Tests whether the mean of a sample is significantly different from a known or hypothesized value.
- Two-sample t-test: Compares the means of two independent samples.
- Chi-square test: Tests for association between categorical variables.
5. Example: Hypothesis Testing in Python
(a) Import Libraries
(b) One-sample t-test
Scenario: You want to test whether the average height of people in a town is 170 cm. You take a sample of 30 people and record their heights.
# Sample data (heights of 30 people)
np.random.seed(42)  # For reproducibility
sample_heights = np.random.normal(168, 5, 30)  # mean=168, std=5

# Perform one-sample t-test
t_stat, p_value = stats.ttest_1samp(sample_heights, 170)

print(f"t-statistic: {t_stat:.4f}, p-value: {p_value:.4f}")

# Significance level
alpha = 0.05
if p_value < alpha:
    print("Reject the null hypothesis: The average height is not 170 cm.")
else:
    print("Fail to reject the null hypothesis: The average height is 170 cm.")
t-statistic: -3.5793, p-value: 0.0012
Reject the null hypothesis: The average height is not 170 cm.(c) Two-sample t-test
Scenario: You want to compare the average heights of men and women in the same town. You have the height data for 20 men and 20 women.
# Heights of men and women (sample data)
np.random.seed(42)
men_heights = np.random.normal(175, 6, 20)
women_heights = np.random.normal(165, 5, 20)

# Perform two-sample t-test
t_stat, p_value = stats.ttest_ind(men_heights, women_heights)

print(f"t-statistic: {t_stat:.4f}, p-value: {p_value:.4f}")

# Decision
if p_value < alpha:
    print("Reject the null hypothesis: There is a significant difference between men's and women's heights.")
else:
    print("Fail to reject the null hypothesis: No significant difference in heights.")
t-statistic: 6.1236, p-value: 0.0000
Reject the null hypothesis: There is a significant difference between men's and women's heights.(d) Chi-square test
Scenario: You want to test whether gender and preference for a product (Yes/No) are independent in a survey.
# Contingency table (sample data)
# Rows: Gender (Male, Female), Columns: Preference (Yes, No)
data = [[30, 10], [25, 15]]

# Perform chi-square test
chi2_stat, p_value, dof, expected = stats.chi2_contingency(data)

print(f"Chi-square statistic: {chi2_stat:.4f}, p-value: {p_value:.4f}")

# Decision
if p_value < alpha:
    print("Reject the null hypothesis: Gender and preference are not independent.")
else:
    print("Fail to reject the null hypothesis: Gender and preference are independent.")
Chi-square statistic: 0.9309, p-value: 0.3346
Fail to reject the null hypothesis: Gender and preference are independent.(e) ANOVA (Analysis of Variance)
Scenario: You want to compare the average heights of people from three different cities to see if there is a statistically significant difference in their means.
Hypotheses: - H₀ (Null Hypothesis): The means of all groups are equal. - H₁ (Alternative Hypothesis): At least one group has a different mean.
# Simulate data for three cities (heights)
np.random.seed(42)
city1_heights = np.random.normal(168, 5, 30)
city2_heights = np.random.normal(170, 6, 30)
city3_heights = np.random.normal(165, 4, 30)

# Combine data into a pandas DataFrame
df = pd.DataFrame({
    'city1': city1_heights,
    'city2': city2_heights,
    'city3': city3_heights
})

# Visualize the data
df.boxplot()
plt.title('Height Distributions for Three Cities')
plt.ylabel('Height (cm)')
plt.show()

# Perform ANOVA test
f_stat, p_value = stats.f_oneway(city1_heights, city2_heights, city3_heights)

print(f"F-statistic: {f_stat:.4f}, p-value: {p_value:.4f}")

# Decision
alpha = 0.05
if p_value < alpha:
    print("Reject the null hypothesis: At least one city has a different mean height.")
else:
    print("Fail to reject the null hypothesis: All cities have the same mean height.")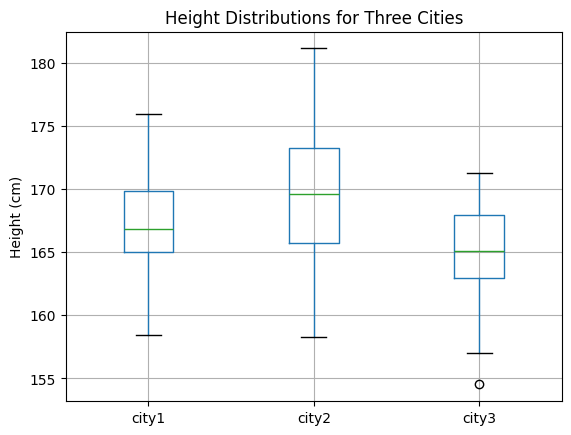
F-statistic: 5.9711, p-value: 0.0037
Reject the null hypothesis: At least one city has a different mean height.
Explanation of ANOVA
F-statistic: A ratio of the variance between the group means to the variance within the groups. A higher F-statistic indicates a greater disparity between group means.
Conclusion
Congratulations on completing this tutorial. Hypothesis testing is a powerful statistical tool used to make data-driven decisions. This tutorial demonstrated how to conduct hypothesis testing in Python with the:- one-sample t-test
- two-sample t-test
- chi-square test
- ANOVA