# Import the libraries we need for this lab

import torch.nn as nn
import torch
import matplotlib.pyplot as plt
import numpy as np
from torch.utils.data import Dataset, DataLoaderSoftmax Classifer 1D
Training Two Parameter, Mini-Batch Gradient Decent, Training Two Parameter Mini-Batch Gradient Decent

Objective
- How to build a Softmax classifier by using the Sequential module in pytorch.
Table of Contents
In this lab, you will use Softmax to classify three linearly separable classes, the features are in one dimension
Estimated Time Needed: 25 min
Preparation
We’ll need the following libraries:
Use the helper function to plot labeled data points:
# Create class for plotting

def plot_data(data_set, model = None, n = 1, color = False):
    X = data_set[:][0]
    Y = data_set[:][1]
    plt.plot(X[Y == 0, 0].numpy(), Y[Y == 0].numpy(), 'bo', label = 'y = 0')
    plt.plot(X[Y == 1, 0].numpy(), 0 * Y[Y == 1].numpy(), 'ro', label = 'y = 1')
    plt.plot(X[Y == 2, 0].numpy(), 0 * Y[Y == 2].numpy(), 'go', label = 'y = 2')
    plt.ylim((-0.1, 3))
    plt.legend()
    if model != None:
        w = list(model.parameters())[0][0].detach()
        b = list(model.parameters())[1][0].detach()
        y_label = ['yhat=0', 'yhat=1', 'yhat=2']
        y_color = ['b', 'r', 'g']
        Y = []
        for w, b, y_l, y_c in zip(model.state_dict()['0.weight'], model.state_dict()['0.bias'], y_label, y_color):
            Y.append((w * X + b).numpy())
            plt.plot(X.numpy(), (w * X + b).numpy(), y_c, label = y_l)
        if color == True:
            x = X.numpy()
            x = x.reshape(-1)
            top = np.ones(x.shape)
            y0 = Y[0].reshape(-1)
            y1 = Y[1].reshape(-1)
            y2 = Y[2].reshape(-1)
            plt.fill_between(x, y0, where = y1 > y1, interpolate = True, color = 'blue')
            plt.fill_between(x, y0, where = y1 > y2, interpolate = True, color = 'blue')
            plt.fill_between(x, y1, where = y1 > y0, interpolate = True, color = 'red')
            plt.fill_between(x, y1, where = ((y1 > y2) * (y1 > y0)),interpolate = True, color = 'red')
            plt.fill_between(x, y2, where = (y2 > y0) * (y0 > 0),interpolate = True, color = 'green')
            plt.fill_between(x, y2, where = (y2 > y1), interpolate = True, color = 'green')
    plt.legend()
    plt.show()
Set the random seed:
#Set the random seed

torch.manual_seed(0)
<torch._C.Generator at 0x7b9882167170>Make Some Data
Create some linearly separable data with three classes:
# Create the data class

class Data(Dataset):

    # Constructor
    def __init__(self):
        self.x = torch.arange(-2, 2, 0.1).view(-1, 1)
        self.y = torch.zeros(self.x.shape[0])
        self.y[(self.x > -1.0)[:, 0] * (self.x < 1.0)[:, 0]] = 1
        self.y[(self.x >= 1.0)[:, 0]] = 2
        self.y = self.y.type(torch.LongTensor)
        self.len = self.x.shape[0]

    # Getter
    def __getitem__(self,index):
        return self.x[index], self.y[index]

    # Get Length
    def __len__(self):
        return self.len
Create the dataset object:
# Create the dataset object and plot the dataset object

data_set = Data()
data_set.x
plot_data(data_set)
Build a Softmax Classifier
Build a Softmax classifier by using the Sequential module:
# Build Softmax Classifier technically you only need nn.Linear

model = nn.Sequential(nn.Linear(1, 3))
model.state_dict()
OrderedDict([('0.weight',
tensor([[ 0.5239],
[-0.4626],
[-0.4925]])),
('0.bias', tensor([-0.0875, -0.0961, -0.7790]))])data_set[0](tensor([-2.]), tensor(0))model(data_set[0][0])tensor([-0.7210, -1.4580, 1.9142], grad_fn=<ViewBackward0>)Train the Model
Create the criterion function, the optimizer and the dataloader
# Create criterion function, optimizer, and dataloader

criterion = nn.CrossEntropyLoss()
optimizer = torch.optim.SGD(model.parameters(), lr = 0.01)
trainloader = DataLoader(dataset = data_set, batch_size = 5)
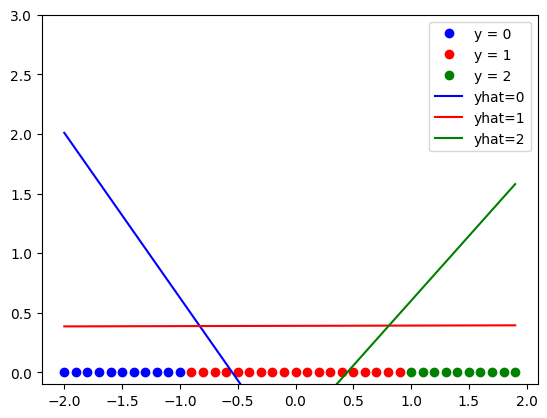
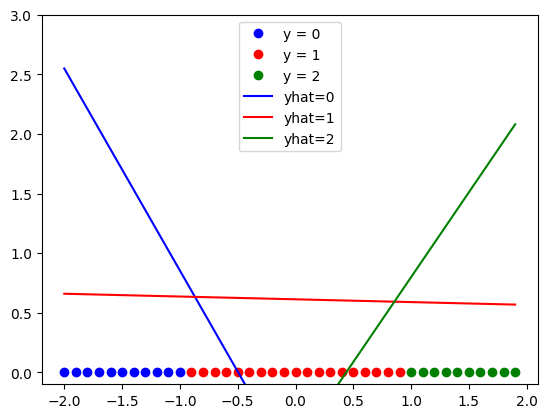
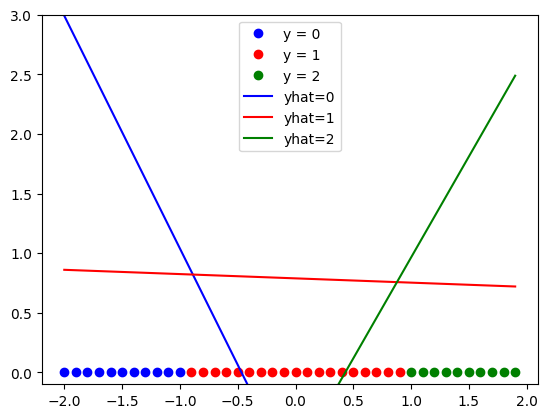
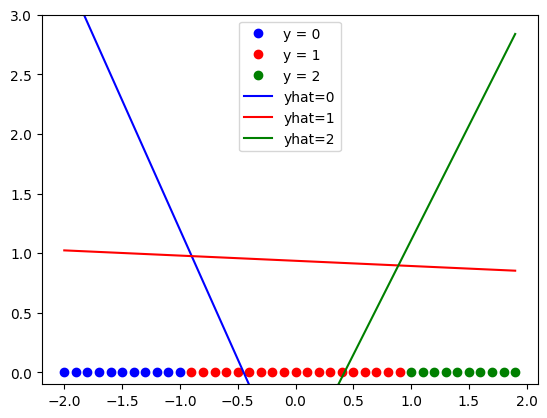
Train the model for every 50 epochs plot, the line generated for each class.
# Train the model

LOSS = []
def train_model(epochs):
    for epoch in range(epochs):
        if epoch % 50 == 0:
            pass
            plot_data(data_set, model)
        for x, y in trainloader:
            optimizer.zero_grad()
            yhat = model(x)
            loss = criterion(yhat, y)
            LOSS.append(loss)
            loss.backward()
            optimizer.step()
train_model(300)


Analyze Results
Find the predicted class on the test data:
pred_0 = model(data_set.x[10:20])
_, yhat_0 = pred_0.max(1)
print(yhat_0)
tensor([0, 1, 1, 1, 1, 1, 1, 1, 1, 1])# Make the prediction
z = model(data_set.x)
_, yhat = z.max(1)
print("The prediction:", yhat)The prediction: tensor([1, 1, 1, 1, 1, 1, 1, 1, 1, 1, 1, 1, 1, 1, 1, 1, 1, 1, 1, 1, 0, 0, 0, 0,
0, 0, 0, 0, 0, 0, 0, 0, 0, 0, 0, 0, 0, 0, 0, 0])Calculate the accuracy on the test data:
# Print the accuracy

correct = (data_set.y == yhat).sum().item()
accuracy = correct / len(data_set)
print("The accuracy: ", accuracy)
The accuracy: 0.225You can also use the softmax function to convert the output to a probability,first, we create a Softmax object:
Softmax_fn=nn.Softmax(dim=-1)The result is a tensor Probability , where each row corresponds to a different sample, and each column corresponds to that sample belonging to a particular class
Probability = Softmax_fn(z)we can obtain the probability of the first sample belonging to the first, second and third class respectively as follows:
for i in range(3):
    print(f"probability of class {i} isg given by  {Probability[0,i]}")
probability of class 0 isg given by 0.08364968001842499
probability of class 1 isg given by 0.5964528322219849
probability of class 2 isg given by 0.31989753246307373